
During a proof of concept, Invofox delivers a detailed performance report showing exactly how documents perform — across accuracy, errors, vendors, processing times, precision, and real-world edge cases.
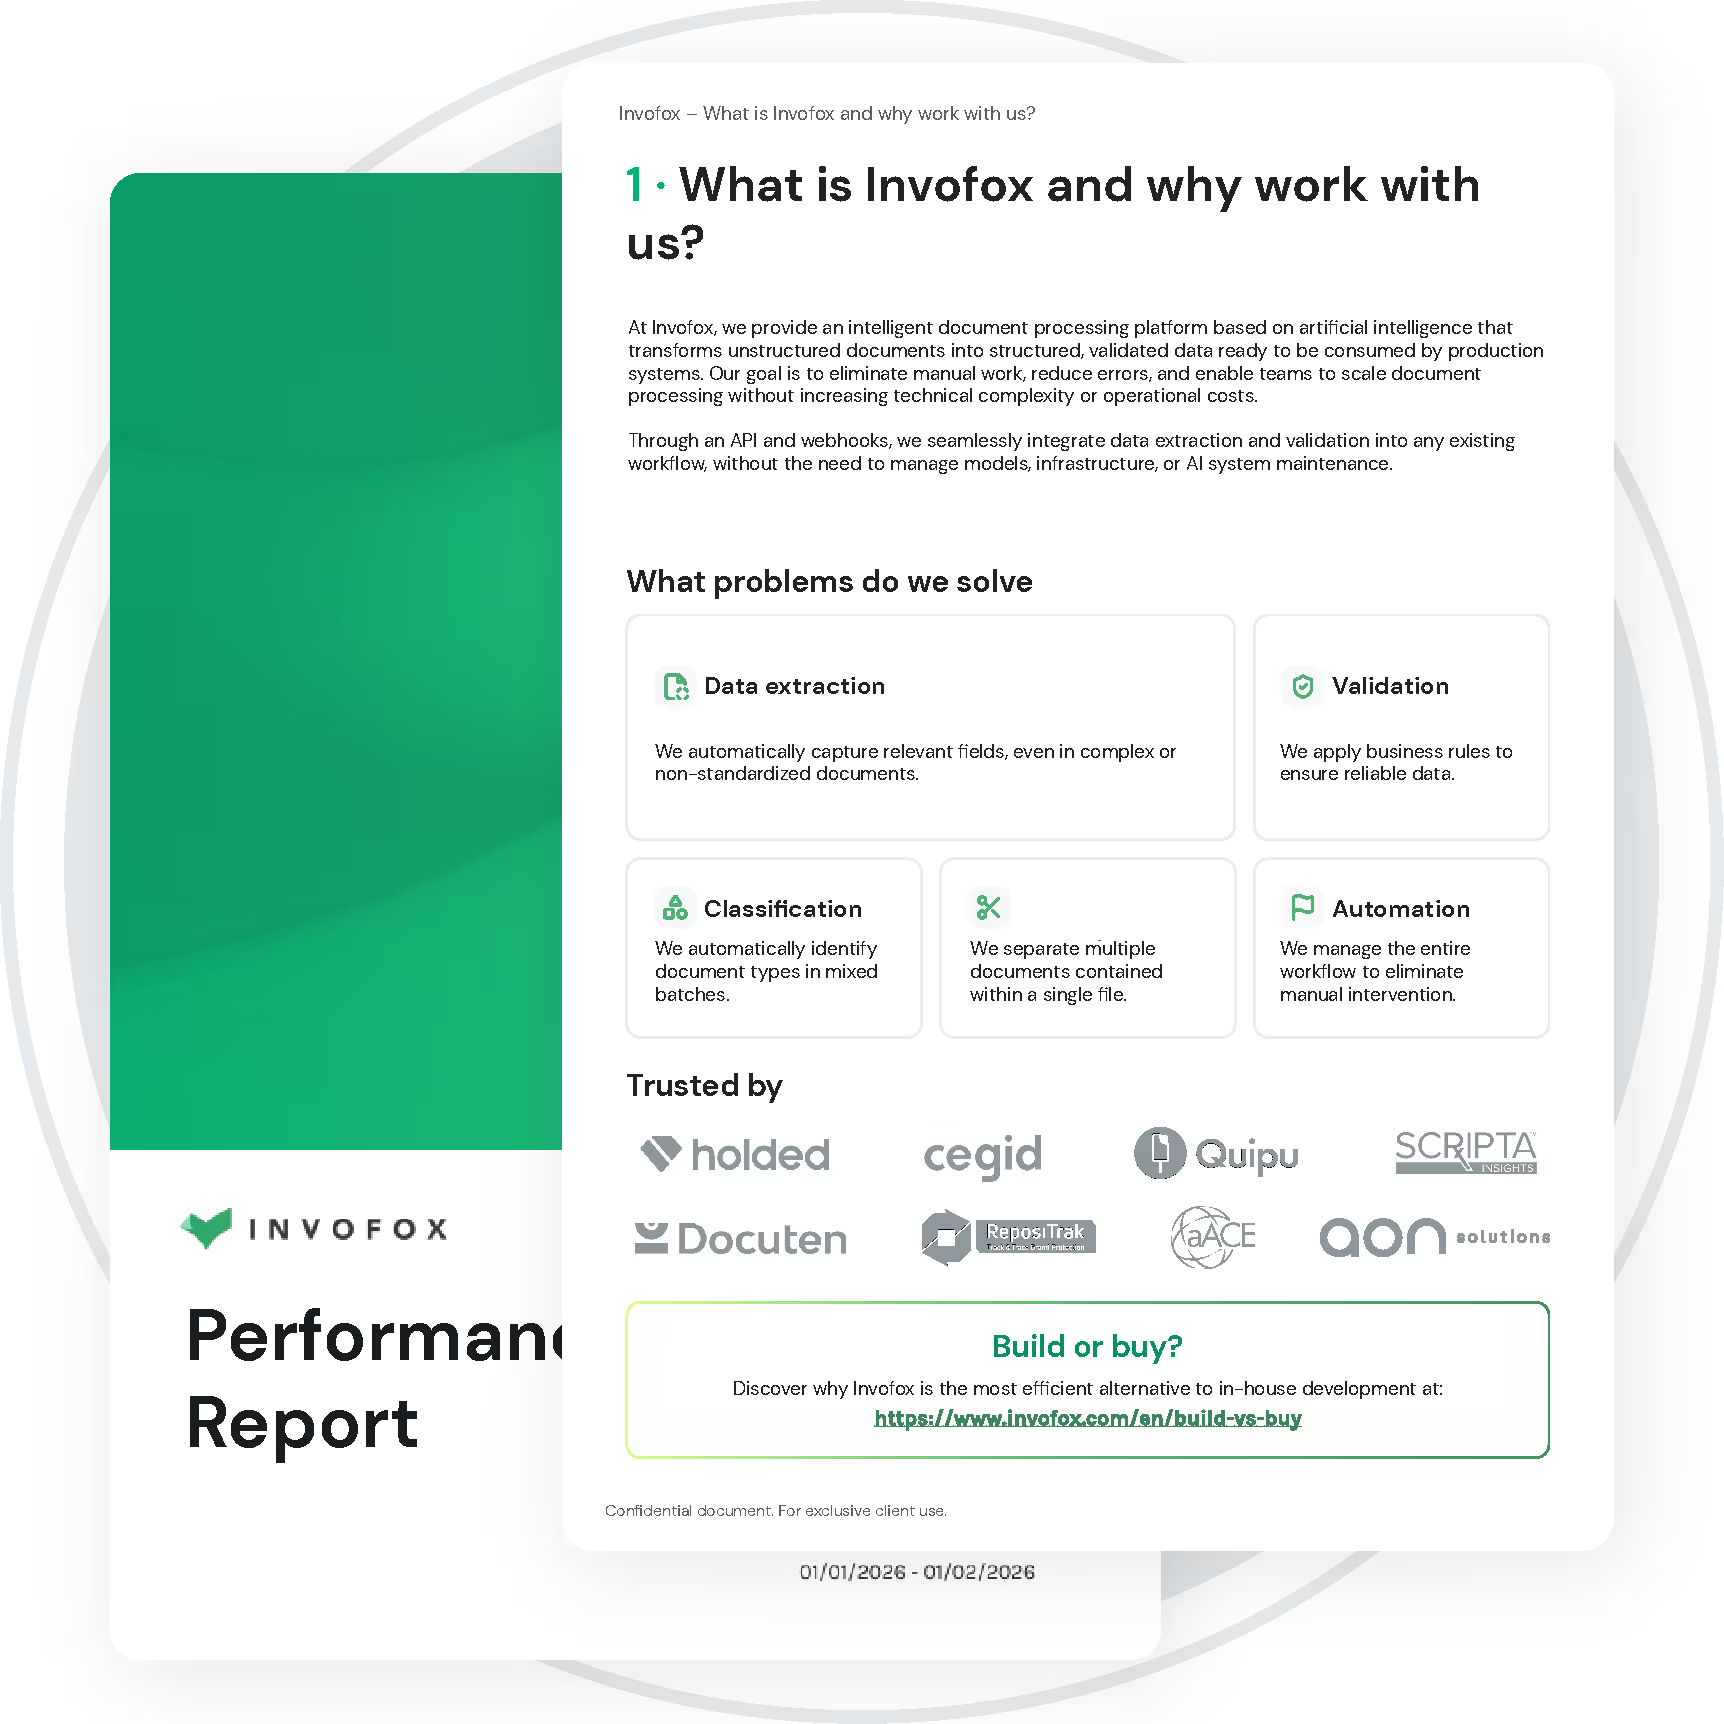


From the first documents processed, accuracy is never a vague promise. It’s a defined, measured outcome.

You share a small, representative sample of your documents, including the corresponding ground truth for evaluation.

We analyze the sample set and schema, split it into different parts, and define success upfront: accuracy targets, confidence thresholds, and evaluation criteria.

We iterate in a continuous improvement loop to refine the pipeline, adjust models, and fine-tune the solution to achieve maximum accuracy.

We process the full document volume, handling thousands of documents and pages, not cherry-picked examples.

We deliver a performance report with a clear, visual breakdown of results you can confidently share internally.
This report is designed to be shared internally — with technical teams, operators, and executives — without additional explanation.
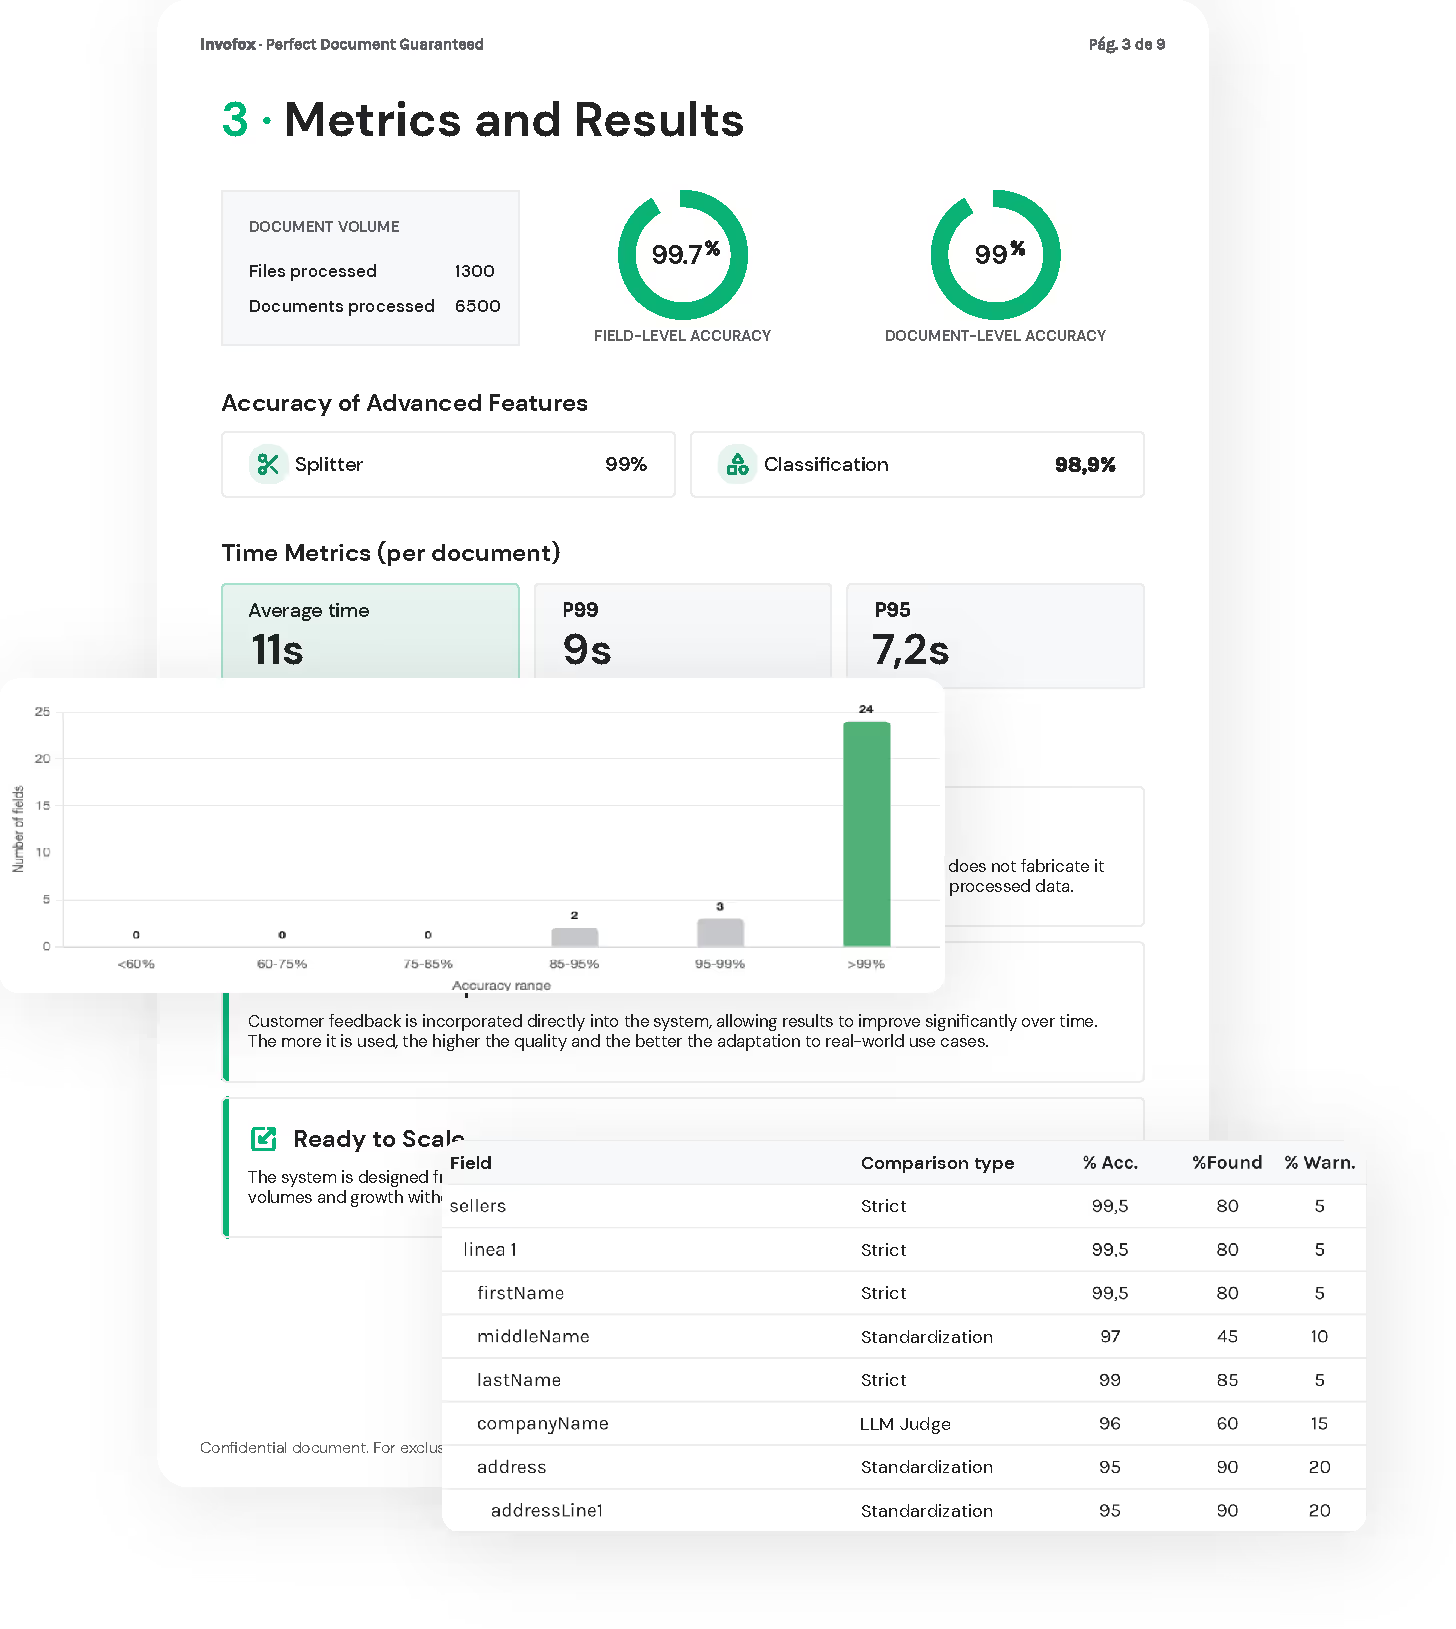
You will receive performance reports with these included metrics and insights:
Overall accuracy (field-level and document-level)
Processing time benchmarks (P95 / P99)
Error distribution and failure types
Missing or low-confidence fields
Confidence thresholds and warnings
Page-level and document-level performance
Splitter and classifier performance
Custom analysis relevant to your use case
All results are calculated using a defined evaluation methodology based on Ground Truth comparisons and are shared transparently.
Get full visibility into accuracy, errors, and edge cases — using your real documents.
Instead of relying on a single average accuracy number, Invofox breaks results down in ways that reflect real production complexity. This allows teams to focus optimization efforts where they have the greatest impact.
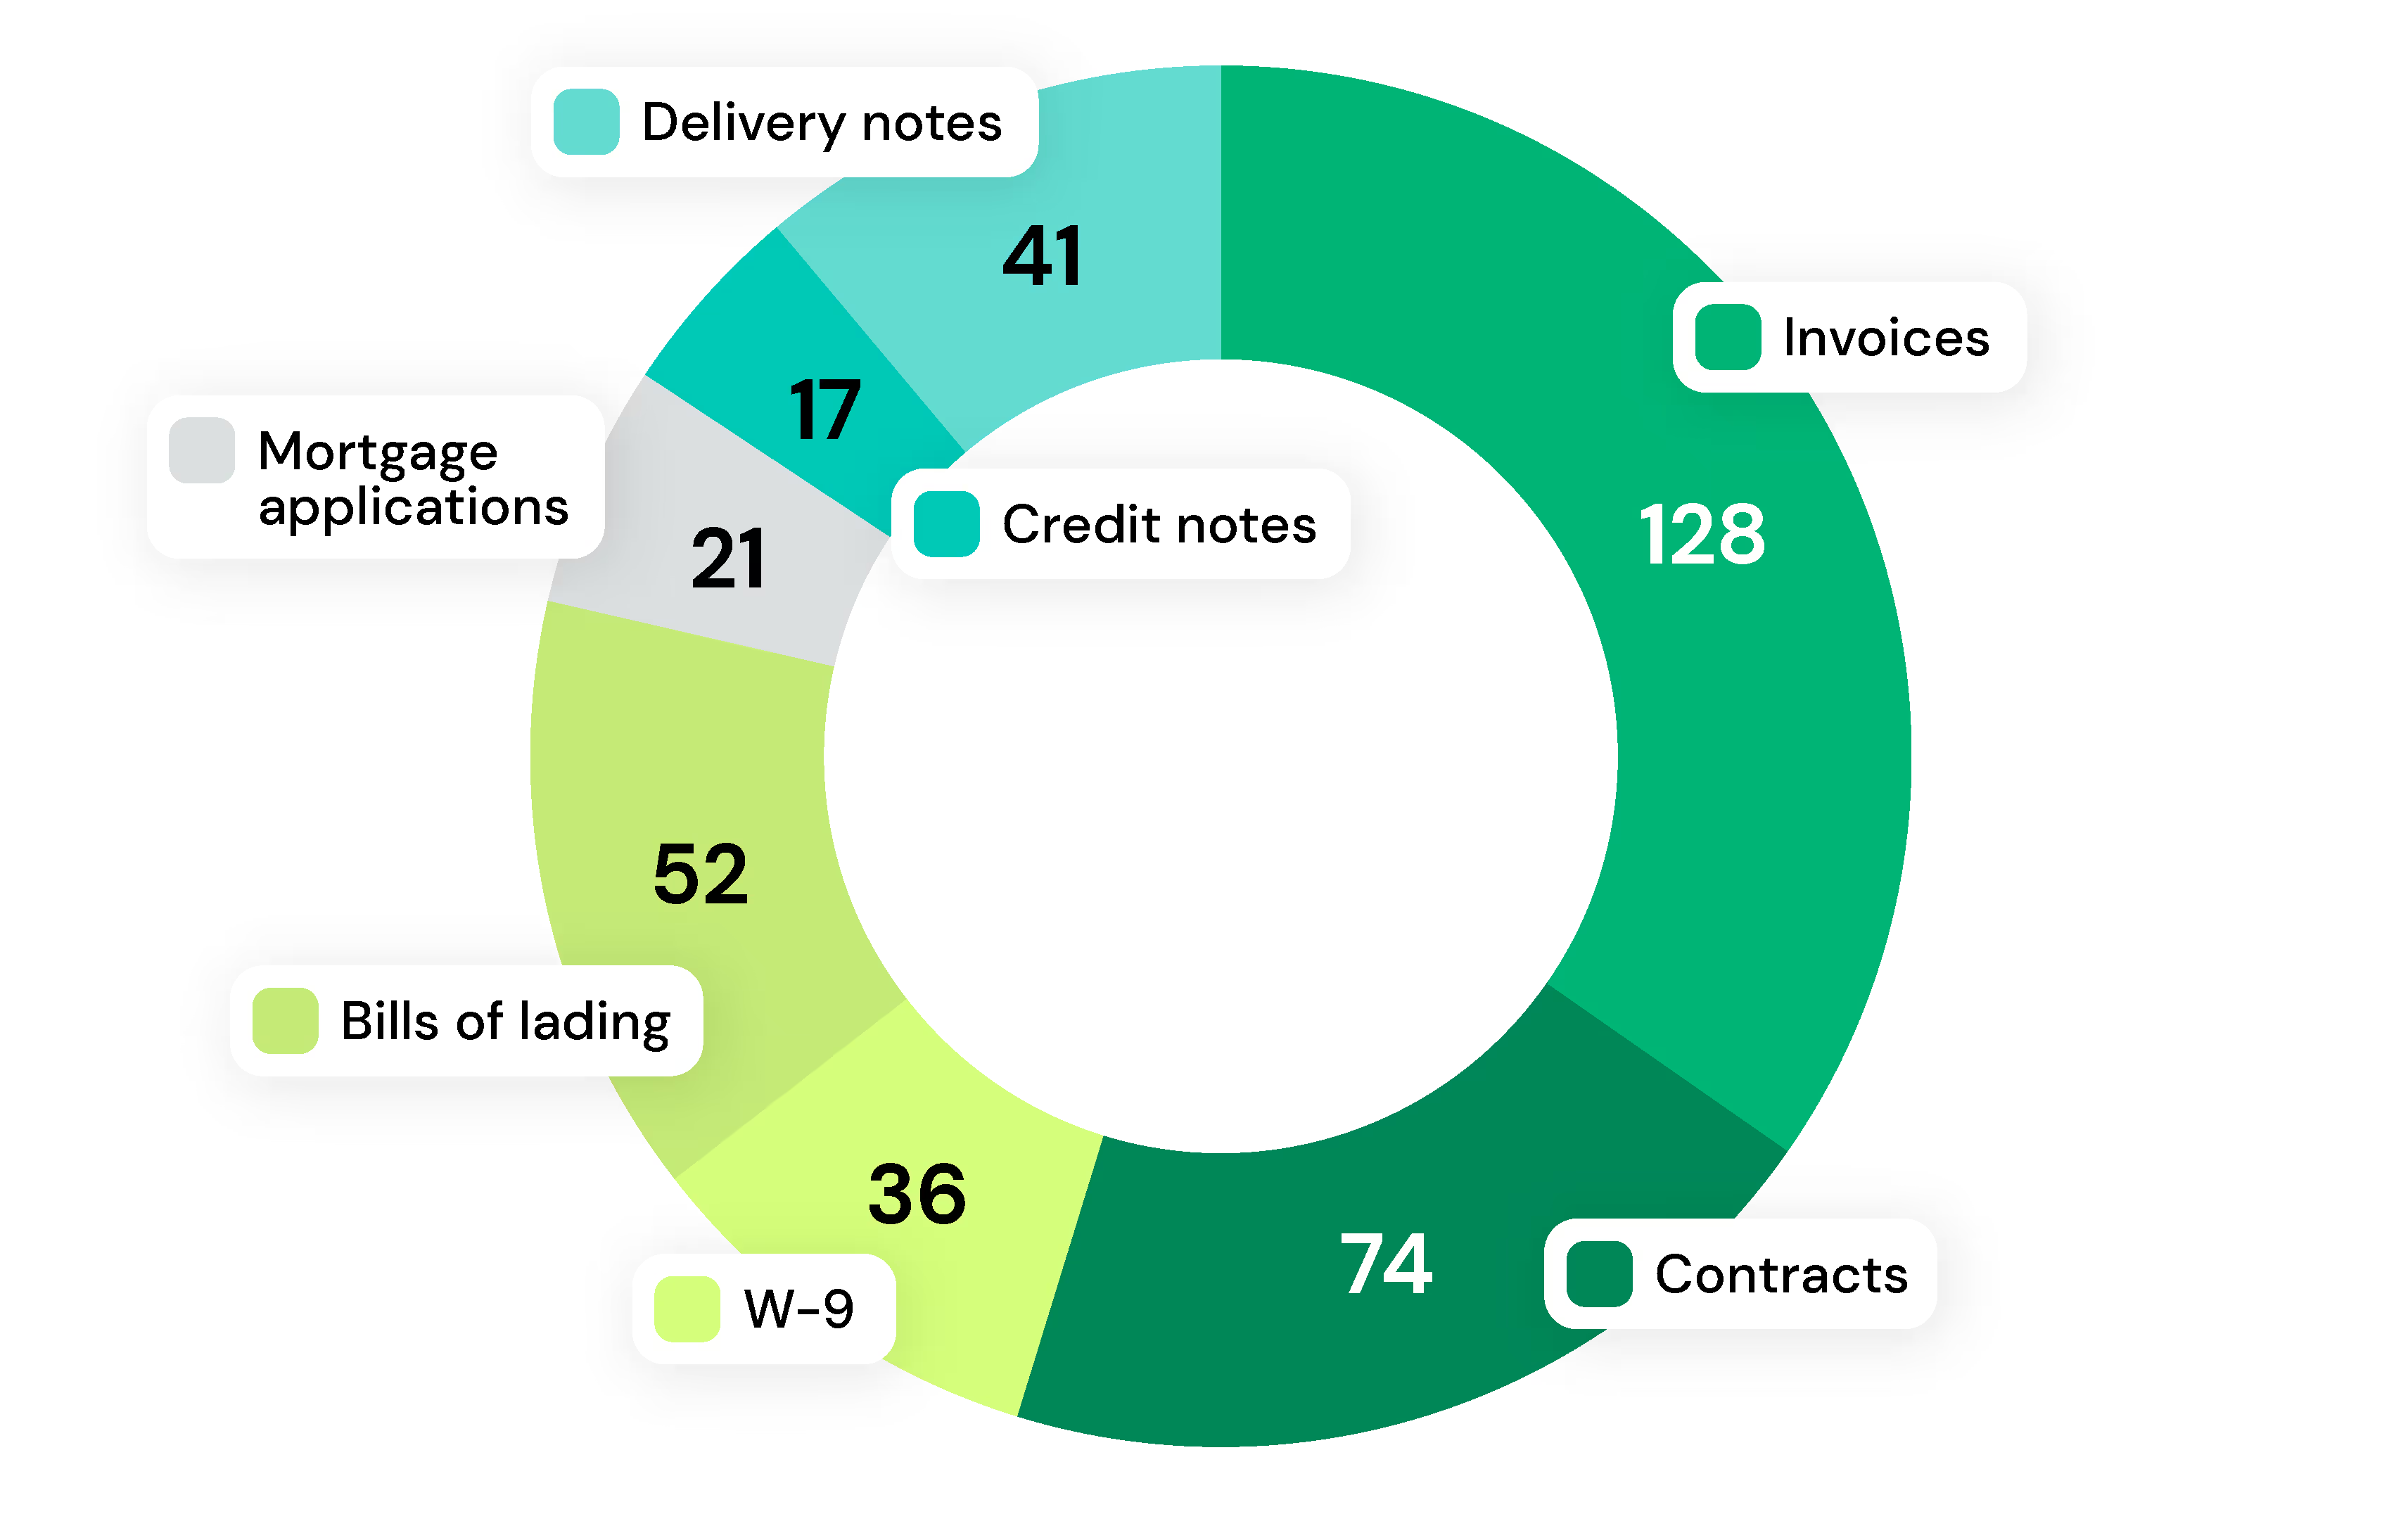
Performance can be segmented by:
Examples include invoices, contracts, tax forms (such as W-9s), bills of lading, mortgage and loan applications, credit notes, delivery notes, etc.
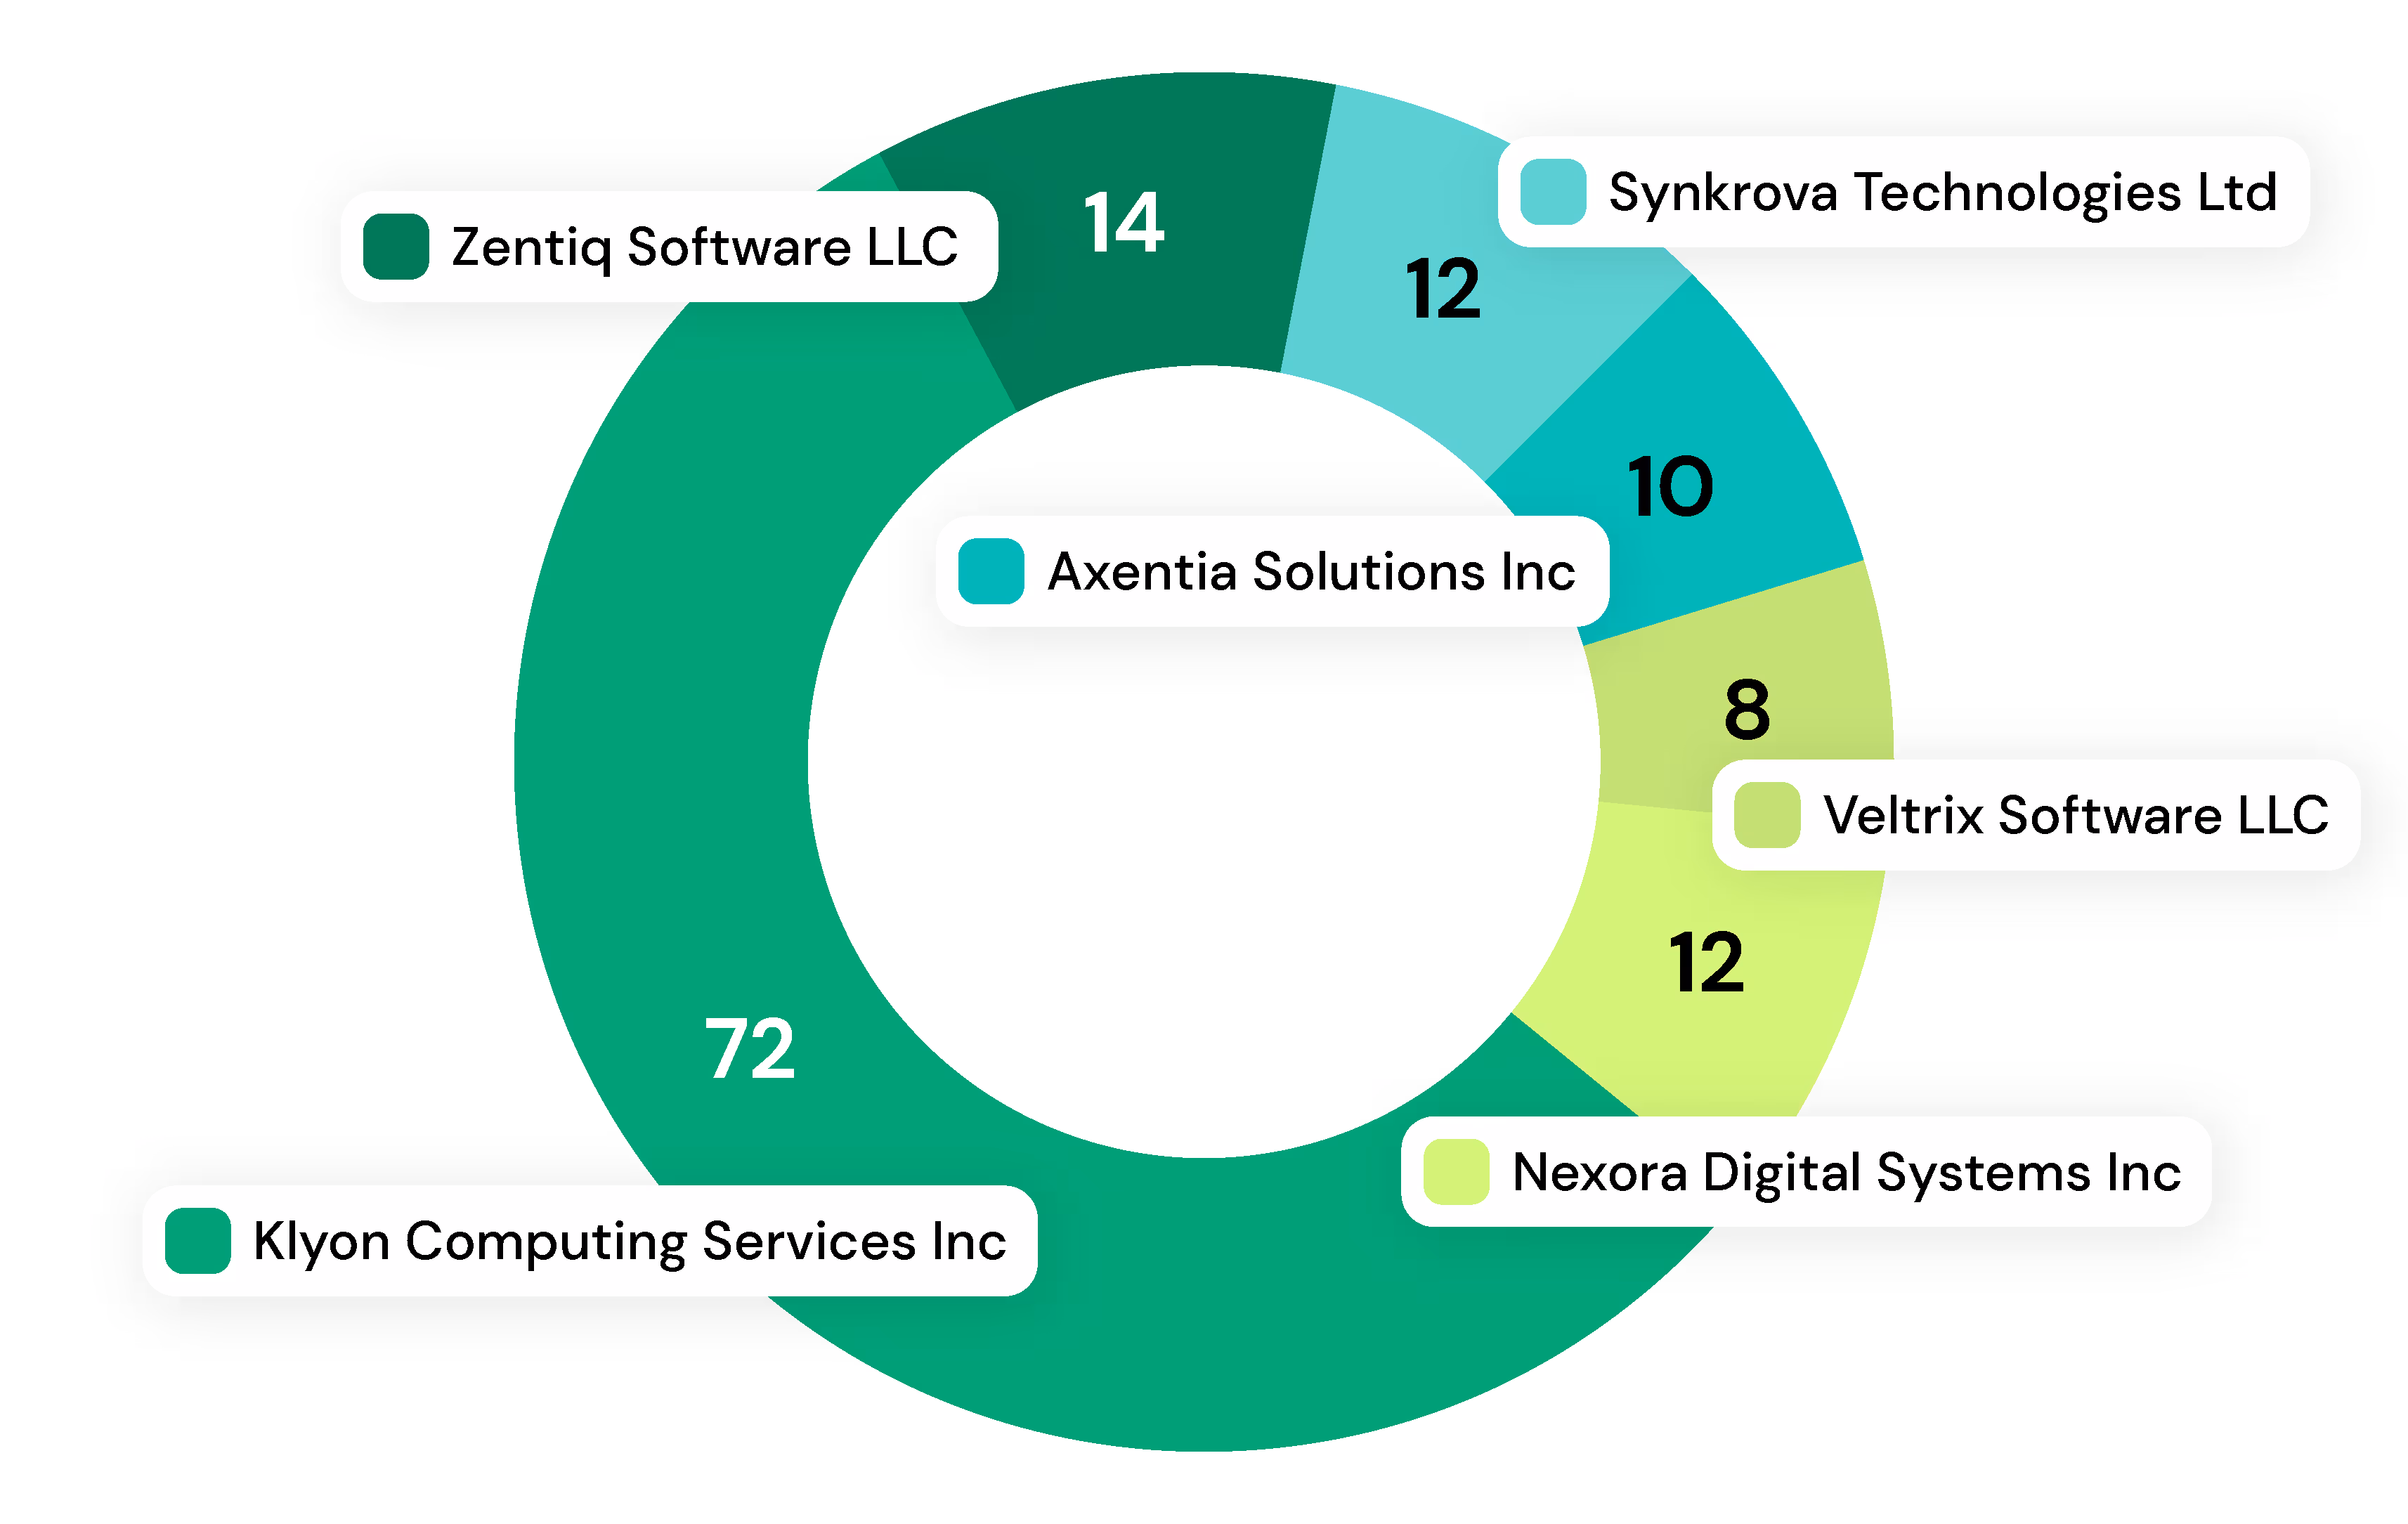
Identify which layouts represent the most volume or variability. Examples include vendors for invoices, states for standard forms, etc.
In real production environments, a percentage of documents will always present issues — poor image quality, missing data, corrupted files, or highly inconsistent layouts. Because of this, achieving 100% automation is often not feasible, regardless of the underlying model.
In large, high-volume deployments, we’ve observed that roughly 5–10% of documents may fall into this category due to data quality constraints alone.
Each report clearly outlines which issues improve with feedback, which require threshold tuning, and where additional data or pipeline adjustments will have the biggest impact.
Performance reports include:

What failed

Why it failed

How often it occured

Whether the main issue was:
Missing information
Ambiguous layouts
Low-confidence extractions
True edge cases
Real documents, real data — a core principle.
